
7,210 clicks in 90 days: receipts attached
- Client
- US specialty clinic, withheld
- Window shown
- 7 Oct 2025 to 5 Jan 2026
- Clicks, 90 days
- 7,210
- Impressions
- 1.21M
- Avg. position
- 9.2
- Dec vs Nov clicks
- +56%
Unedited platform data
Dates visible
Identity withheld
Dips kept in
Method repeatable
In this study
Quick answers
The questions most readers arrive with.
What happened here, in one paragraph?
Is this real?
What would this scope cost?
The starting point
A steady practice with a flat search line.
Look at the left edge of the trend chart further down this page, because that is the whole diagnosis. In early October the clinic’s site was earning a few dozen clicks a day. The impressions line drifted sideways. Average position sat just off the first page, in the zone where a listing technically ranks but practically does not exist, since the overwhelming majority of clicks go to results above it.
The practice itself was not struggling. Referrals were steady, the clinical reputation was real, and patients who found the clinic stayed with it. That is precisely what made the search channel’s underperformance expensive: every day, patients in its own area were searching for exactly what it offered, finding competitors with weaker medicine but stronger visibility, and booking there instead. The cost of poor search presence never shows up as a bill. It shows up as other people’s new patients.
This starting profile, good practice, invisible online, is the most common one we see, and the most fixable. The hard assets already exist: genuine expertise, real patient trust, clinical substance that content can be built on. What is missing is structure, the technical and informational architecture that lets search engines and, increasingly, AI assistants see what patients already know.
The metrics
Four numbers you need, in plain language.
Search Console is the source of truth for how Google sees a site. If you can read these four metrics, no agency can ever fog a report at you again, including us.
Impressions
How many times the site appeared anywhere in Google’s results, whether or not anyone clicked. Think of it as how often your practice was on the shelf. Impressions growing means Google is showing you for more searches, which is always the first thing to move in a working program. This site: 1.21 million in 90 days.
Clicks
Average position
CTR (click-through rate)
Who did what
One builder, one communicator, no handoffs.
Muhammad Haseeb Sheikh: strategy and execution, end to end
Haseeb designed the program and then did every piece of it himself. The technical rebuild and crawl cleanup. The content architecture that decides which pages exist and what each one is for. The internal linking that concentrates authority where it earns most. The schema layer that makes every page machine-readable. And the weekly Search Console review that decided, with data instead of opinions, what got built next.
No juniors learning on the account, no offshore content mill, no handoffs where context dies. One accountable builder whose name is on this page, which is also why the chart is publishable at all.
Abdul Rehman: onboarding and client communication
Abdul ran the engagement’s human side, which matters more than most agencies admit. Structured onboarding captured the practice’s services, tone and clinical boundaries before anything was built. Expectations were set honestly at kickoff: months of foundations before visible movement, a written timeline, no ranking promises.
Then every client conversation through the engagement, monthly reporting calls in plain language, questions answered the same day, and the physician never once needing to translate marketing jargon or chase a status update. Communication is not decoration on an engagement; it is why this one never wobbled when the chart briefly did.
The method
Phase by phase: deliberately unexotic, relentlessly consistent.
Foundations: make the site technically legible
Before any content, the crawl problems went: indexing conflicts, duplicate and orphaned pages, speed drags, broken internal paths. Search engines cannot rank what they cannot cleanly read, and healthcare sites accumulate technical debt quietly for years. This phase is invisible in the chart, which is exactly why October looks flat, and exactly why impatient practices fire good agencies six weeks too early.
Architecture: decide what deserves to exist
Keyword and question research in the patient’s own language, not clinical vocabulary, mapped into a content architecture: which services get pages, which questions get answers, what links to what. The structural insight most sites miss is that pages compete or cooperate depending on how they are organized; architecture decides which. Every page got a defined job, a defined query family, and a defined place in the internal link graph.
Build: pages that fully answer, structured for machines too
Content written to answer the patient’s actual question completely, reviewed for clinical accuracy, opening with the direct answer, structured with question-shaped headings, and carrying schema markup throughout, so both classic search and AI-driven answers can read, trust and quote it. This is the phase where impressions start climbing, as Google begins testing the new pages against more queries. You can see that in the purple line’s steady rise from late October.
Iterate: let Search Console pick the next move
Weekly, the platform’s own data answered the only questions that matter: which queries are gaining impressions but not clicks (title and snippet work), which pages are stuck on page two (internal links and content depth), which unexpected queries are appearing (new content opportunities). December’s acceleration is not magic; it is October’s and November’s decisions compounding while new ones stack on top.
The timeline
What each month looked like, against the chart.
| Month | What the chart shows | What was happening | What the practice felt |
|---|---|---|---|
| October | Flat clicks in the 20s and 30s daily; impressions drifting near baseline | Technical foundations, architecture research, first builds entering the index | Honestly, nothing yet. This is the month that tests whether expectations were set properly at onboarding. They were. |
| November | Impressions climbing steadily; clicks volatile, spiking to 130+ then dipping mid-month | Content and linking compounding; Google testing the site against many more queries; one visible mid-month dip | First real movement, and the first test of nerve when the dip arrived. The monthly call explained it before the client had to ask. |
| December | 3,210 clicks, up 56% on November’s 2,060; impressions 545k vs 341k; position 9.6 to 9 | Compounding took over; iteration doubled down on what the data said was winning | The month the channel became undeniable: more patients arriving from search than from anywhere except referrals. |
| Early January | Steepest lines in the whole window, both metrics at their highs | Trajectory carrying forward; next-phase targets set from position-8-to-10 clusters | The question flipped from is this working to how far can it go. |
The screenshots
The receipts, and how to read them.
7,210
1.21M
9.2
+56%
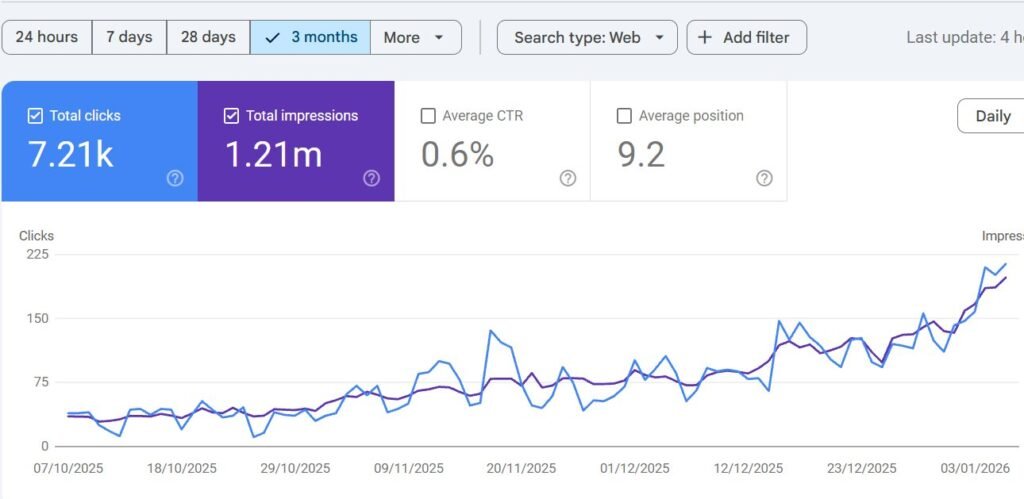
Exhibit one: the 90-day record. Read it left to right like a story. October: flat, foundations underground. Late October onward: the purple impressions line climbs first, Google testing the rebuilt site against more searches. November: blue clicks follow, volatile, including the honest mid-month dip. December into January: both lines steepen together, clicks peaking above 200 a day, the compounding phase every earlier week paid for. Cropped only to remove identifying details.
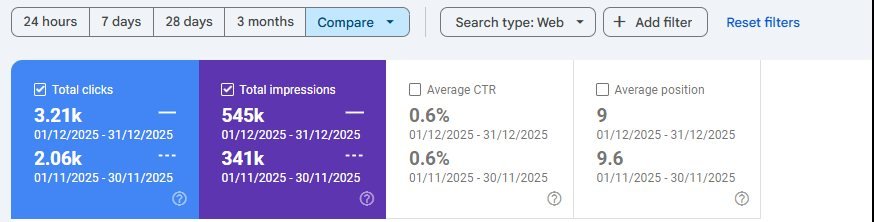
Exhibit two: December versus November, like for like. Clicks 3,210 against 2,060: 56 percent growth in one month. Impressions 545,000 against 341,000: 60 percent more shelf presence. Average position 9.6 to 9: the whole ranking footprint shifting upward at once, which is what architecture-led programs do, in contrast to single-keyword wins. CTR steady at 0.6 percent while position improves means the click growth is structural, not a fluke of one viral query.
The honest part
The dips stay in the story.
Look at mid-November on the trend chart: clicks sag for several days before recovering into December’s climb. We could have chosen a window that hides it. We did not, because that dip is what real search behavior looks like. Google reshuffles results continuously; freshly ranking pages get tested, demoted, retested and promoted; seasonality and indexing lag leave fingerprints on every honest chart. An agency whose charts never wobble is showing you something curated.
The second admission: October is boring, and it is supposed to be. Foundational months produce nothing visible, because their output is technical legibility and architecture, not clicks. The practice that panics in week six and fires its agency never gets to see December, and the agencies that promise December in week six are the reason that practice panicked. Both failure modes have the same cure: honest timelines at onboarding, which is exactly what Abdul set on day one.
Third: this growth curve will not continue at this slope forever, and we will not pretend otherwise. Real programs move in stair-steps: acceleration as a cluster of work matures, a plateau while the next cluster builds, then another step. The quarterly strategy reviews in this engagement exist precisely to plan the next stair before the current one flattens.
The contrast
What was done here vs what usually gets sold.
If you have bought marketing before and it did not look like this engagement, this table is probably why.
| Dimension | This engagement | The typical alternative |
|---|---|---|
| Who executes | A named co-founder, end to end | Account manager fronting a rotating junior team |
| Strategy source | Weekly Search Console data | A fixed deliverables checklist, same for every client |
| Content standard | Answers the patient’s question fully, provider-reviewed | Word-count-driven posts nobody at the practice has read |
| Reporting | Plain language, sourced numbers, arithmetic you can verify | Dashboard exports with vanity metrics and no interpretation |
| Timeline honesty | Flat first months disclosed at kickoff, in writing | First-page promises, then excuses |
| Proof standard | Unedited platform screenshots, dips included | Cherry-picked wins, trimmed windows, no receipts |
Does this map to you
The same method, by practice type.
Direct primary care
Education-first emphasis
Dental, dermatology, med spa
Service-page and local emphasis
Mental health
Trust and sensitivity emphasis
Saudi clinics
Bilingual, compliant emphasis
Failure modes
Five mistakes this engagement deliberately avoided.
- Skipping foundations to publish content fast. Content on a technically broken site is furniture in a house with no floor. October existed for a reason.
- Writing for clinicians instead of patients. Patients search in symptoms and frustrations, not procedure vocabulary. The keyword research started from their language.
- Letting pages compete with each other. Without deliberate architecture, similar pages split authority and both lose. Every page here had one defined job.
- Reporting activity instead of outcomes. Posts published is an activity. Clicks, positions and inquiries are outcomes. Only outcomes appeared in the monthly calls.
- Quitting inside the flat months. The single most expensive mistake in healthcare SEO, and the reason expectation-setting at onboarding is a deliverable, not a courtesy.
Your move
The method is repeatable. Your numbers are yours.
Questions owners ask
Asked and answered.
Why is the clinic's name withheld?
What exactly did the engagement produce?
Who did the work?
How long did results take?
What do clicks, impressions and position actually mean?
Is a 0.6% click-through rate good?
Was the data selected to look better?
Does growth like this continue forever?
No, and nobody honest says otherwise. Real programs move in stair-steps: acceleration, plateau while the next cluster matures, then another step. Quarterly reviews exist to plan the next stair before the current one flattens.
Would this work for my specialty, or in Saudi Arabia?
What would this cost my practice?
More from the shelf
Related studies.
Scenario
USA
Turning honest medical content into rankings for a specialty clinic
Read the study →
Google Ads
USA
Turning ad spend into booked patients instead of clicks
Read the study →
Local + Reputation
USA
Read the study →